


Key aspects
The architecture of the program is built taking into account the many years of experience for development of electronic devices, and its functionality includes modern methods of collecting and processing data, and also combines all the needs and features of both sophisticated and new EPR users.
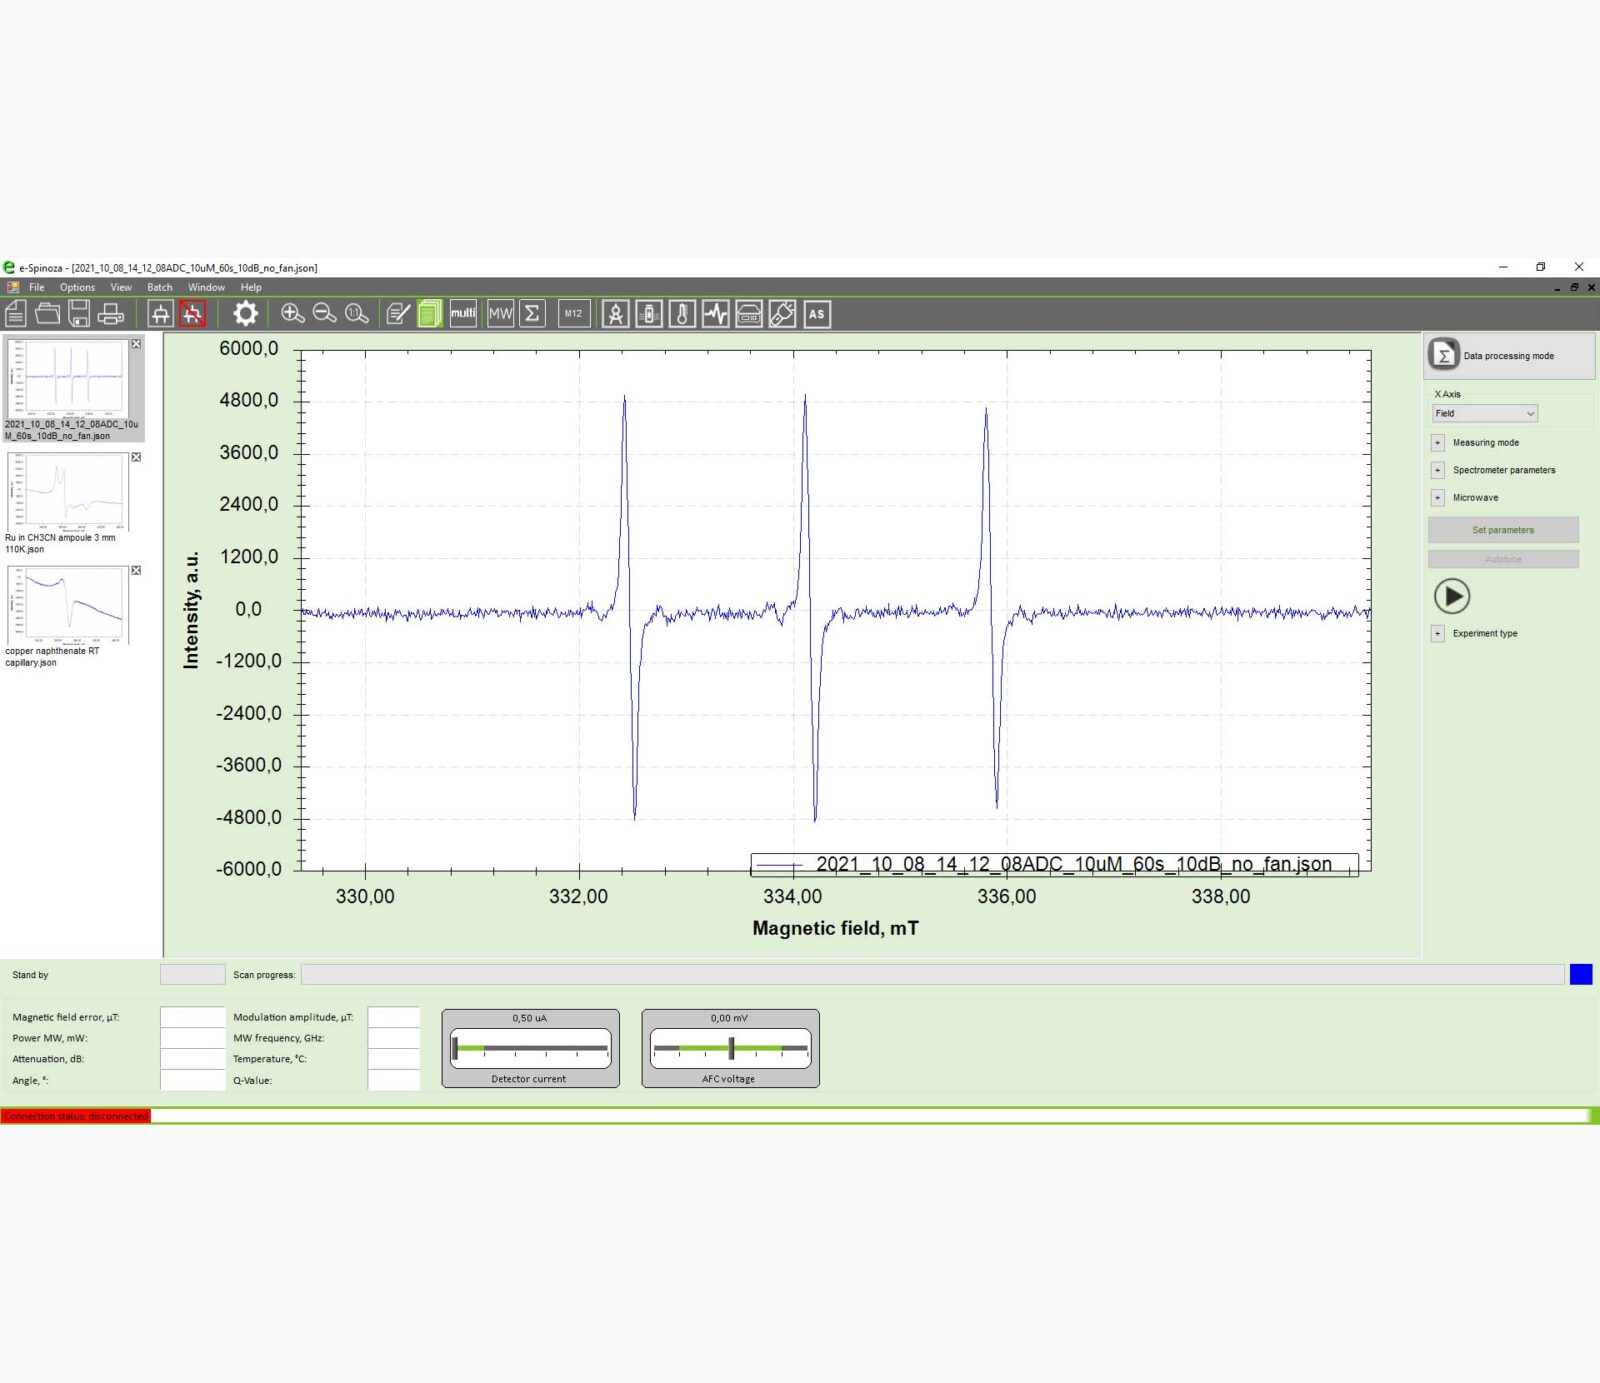
The e-Spinoza has a user-friendly interface and intend to use for EPR spectrometer SPINSCAN control, data acquisition and its processing.
Key features
The intuitive interface of the program provides a logical workflow, starting with setting the main parameters of the experiment (modulation frequency, sweep width and magnetic field, modulation amplitude etc). The most important indicators of instrument performance on the indicator’s panel allow the operator to continuously monitor the measurement process.
To visualize the process of tuning the resonator with the microwave bridge, the program interface has a separate window for its monitoring. The user can observe how the MW frequency, coupling and phase adjusting automatically, as well as he may correct and configure in some cases process independently in manual or semi-automatic modes. This function is very helpful to better understand the mechanisms of registration of the EPR phenomenon to students who learn the course of EPR spectroscopy.
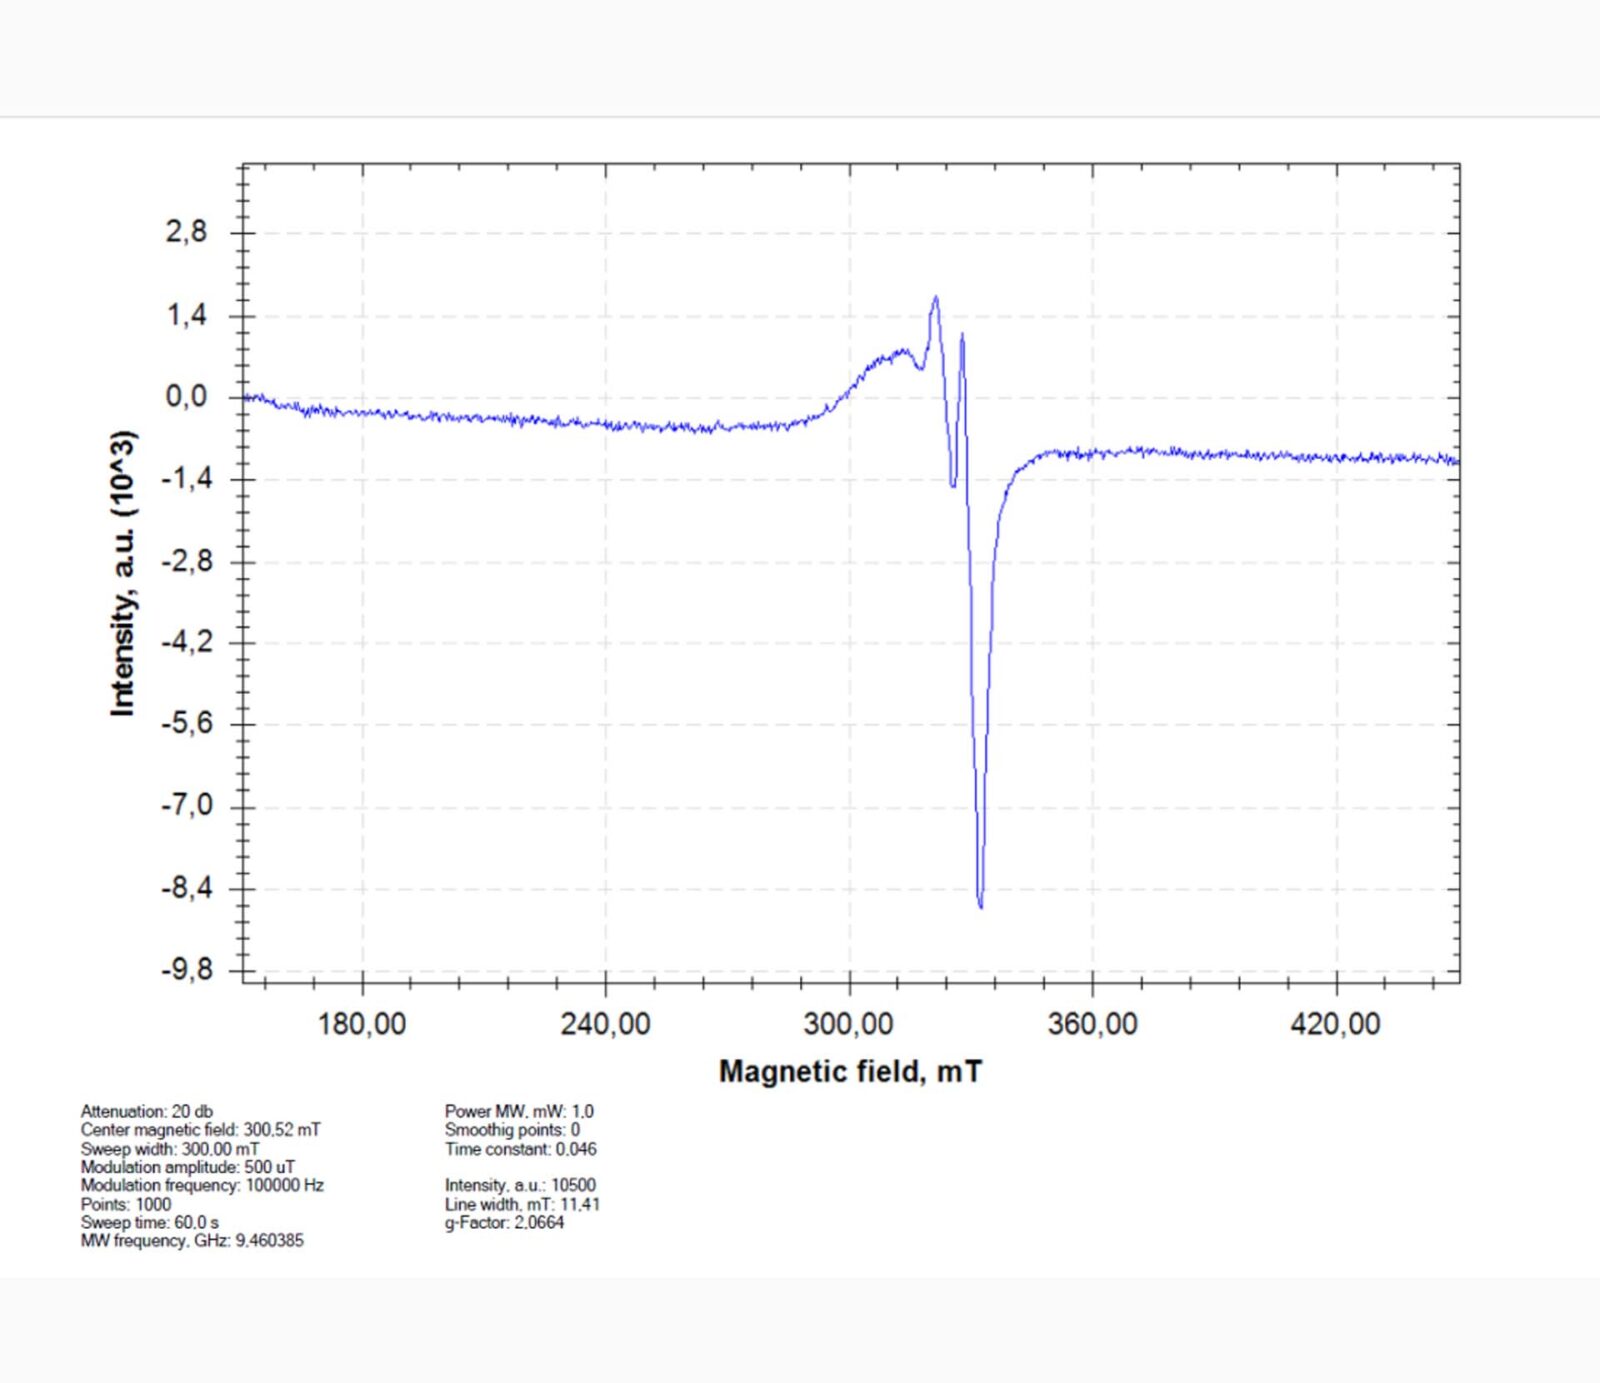
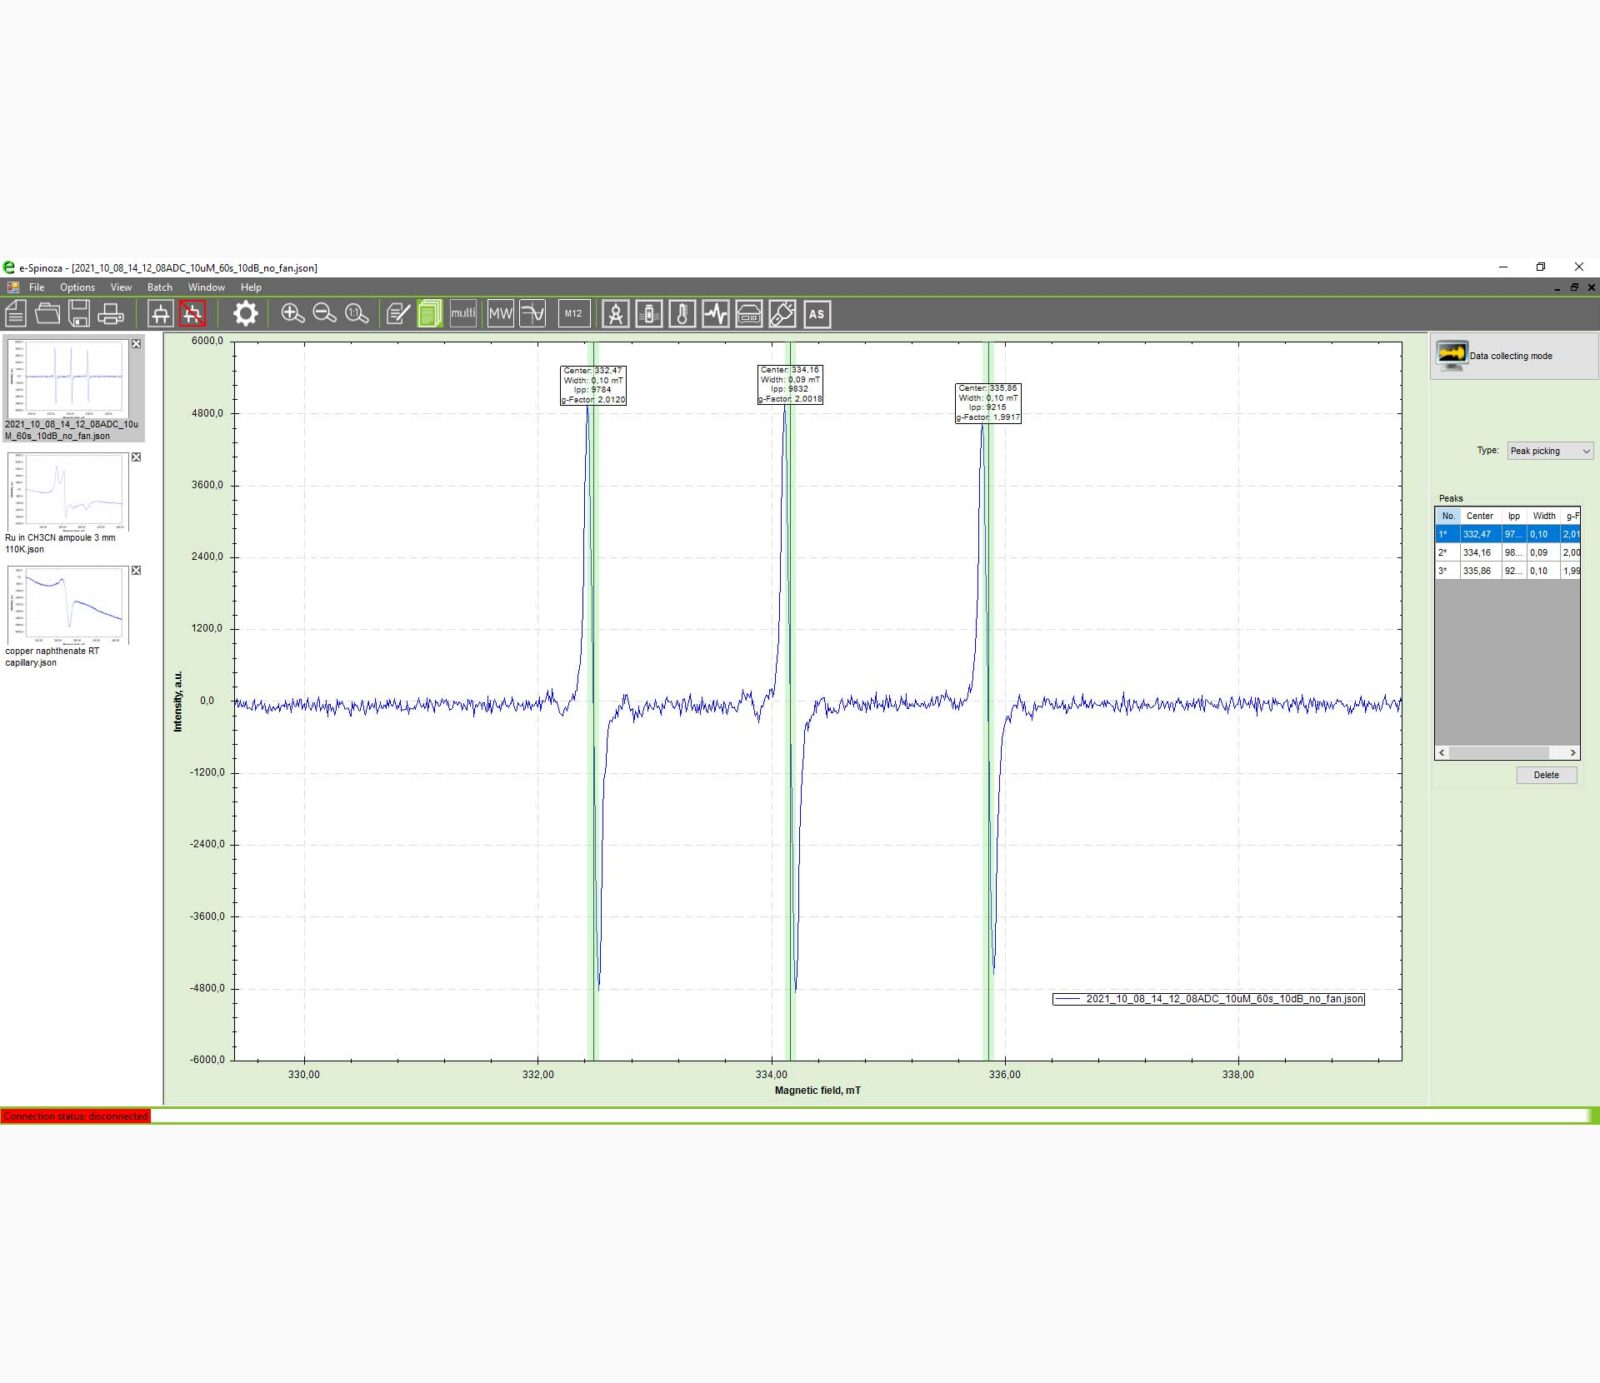
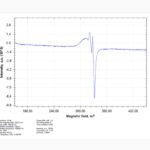
The graphical editor of the e-Spinoza program visualizes the measurement process online and, due to the wide dynamic range of the ADC, makes it possible to observe both weak and strong peaks in the spectrum in one scan. The program has the wide array of standard Spectra analysis tools (zooming, fragmentation etc). Each measured EPR spectrum is accompanied by an experiment report, saving all the important parameters of the experiment for their subsequent analysis.
A convenient system for storing measurement results, saving and exporting spectra in various formats, and a built-in print editor make the user’s work more efficient.
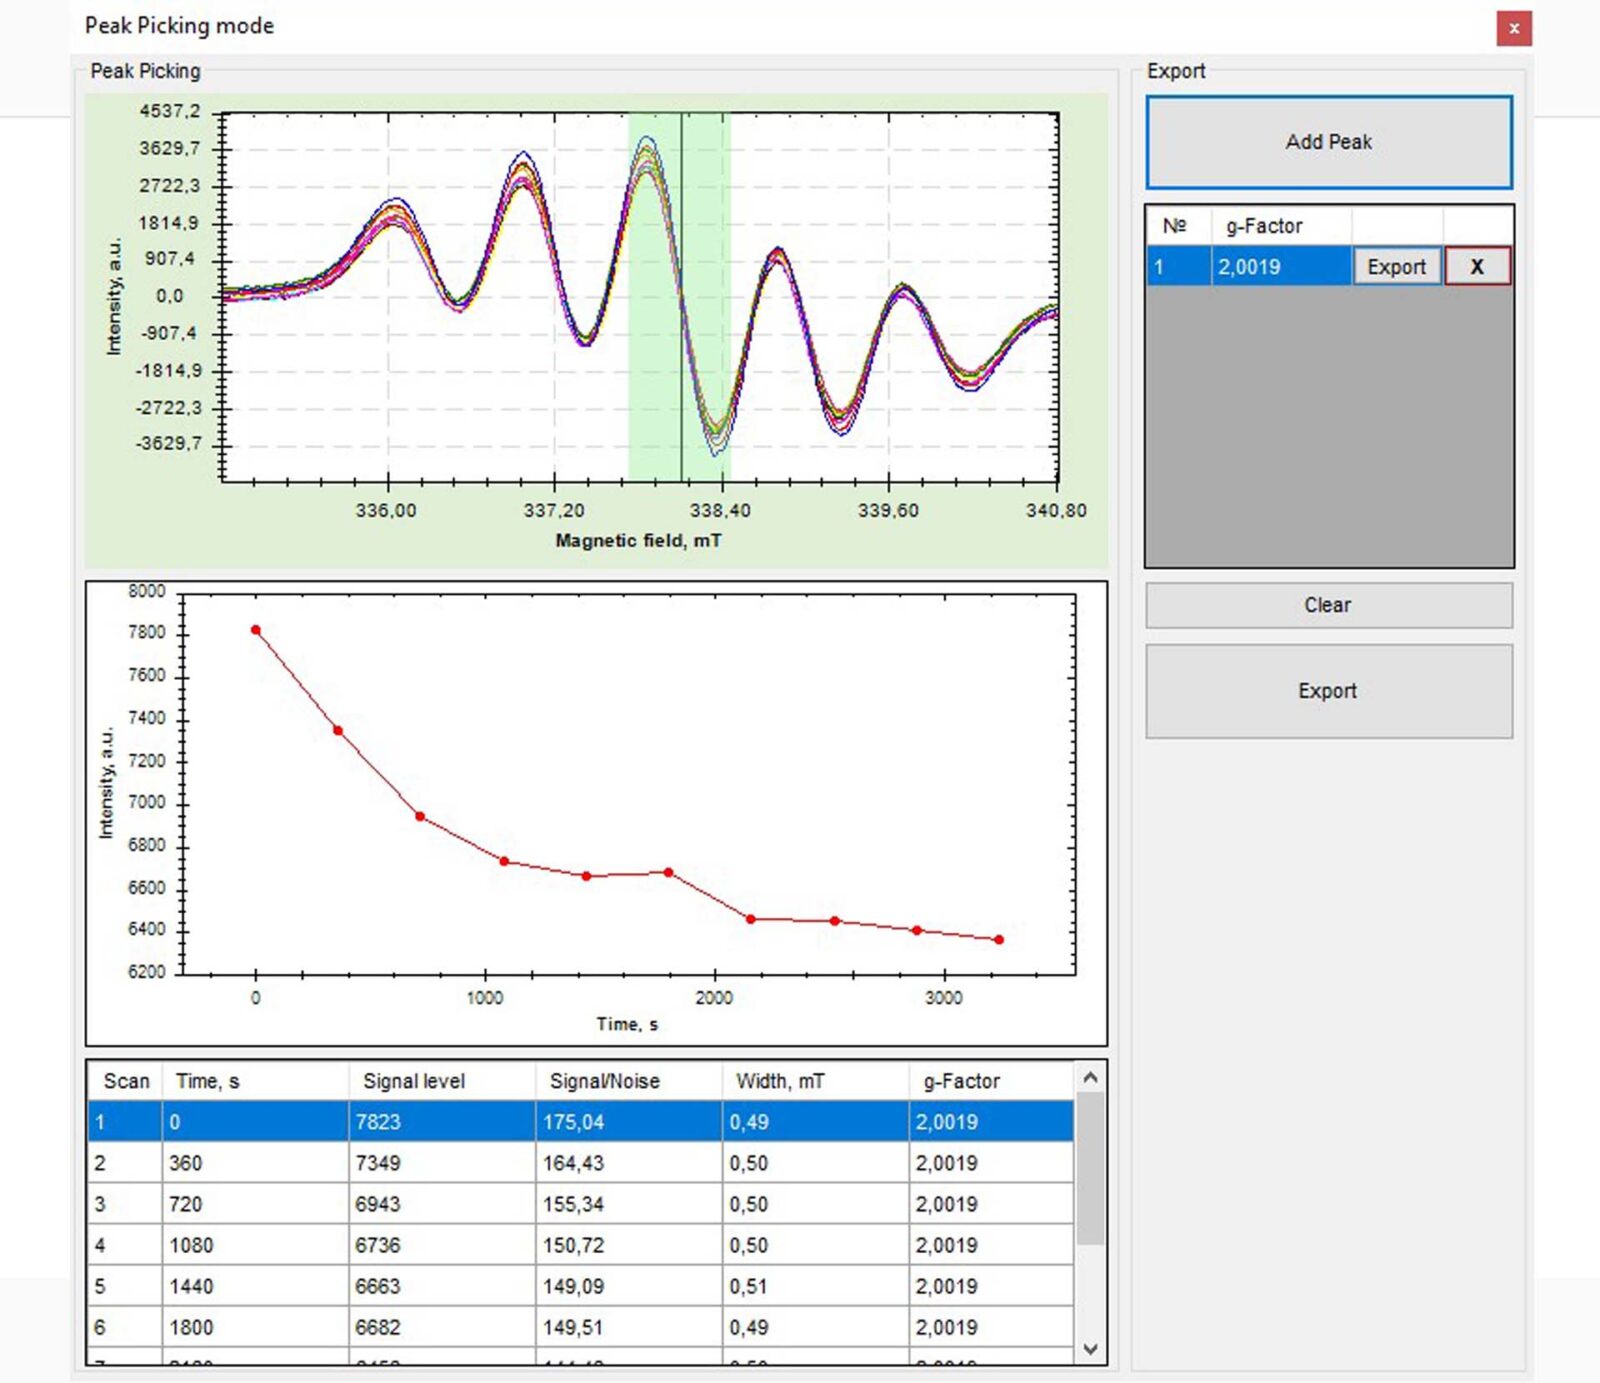
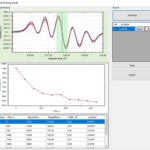
The software package e-Spinoza implements the automation of frequently repeated actions when performing an routine experiments, as well as of 3D experiments – recording EPR spectra with varying temperature, modulation amplitude, microwave power or attenuation, and time delay to study the kinetics reaction.
A processing the acquired data is another exciting part of the program provided in a separate independent window which active even offline. In addition to exporting data to various formats (ASCII, txt, excel, pdf, png), the program has a set of mandatory functions used by researchers for data processing:
Base-line correction, data processing: integration, differentiation, smoothing and averaging, phase shifting detection.
Without using external data processing programs, e-Spinoza allows for mathematical fitting of spectra by analytical functions – Lorentz-Gauss, which is subsequently used for radicals simulating and quantitative analysis of spins in the sample.
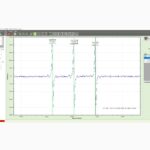
The built-in module to working with an batch of experimental data allows to do a comparative analysis of spectra obtained at different times, or with different magnetic field sweep widths.
The program has a built-in script editor, which can be used to automate frequently repeated actions when performing an experiment, as well as do much more. Every researcher by himself (or with the help of a developer) can easily create unique subprograms for own experimental receipts and algorithms, having mastered the Python programming language. For example, the researcher may acquire data for a certain number of scans or for a certain time interval and each scan cycle can be triggered by an external signal or by a specific event.
Further development of e-Spinoza
The e-Spinoza program is constantly evolving based on user feedback and needs. It is recommended to regularly check for updates using the Update Center. The program is updated free of charge.
Minimal system requirements
- CPU core i3
- DDR3 1Gb
- HDD 160 Gb
- Monitor at least 19”
- OS Windows 7, 8 or 10
- Interface Ethernet
Peculiarities:
The intuitive interface of the program provides a logical workflow, starting with setting the main parameters of the experiment (modulation frequency, sweep width and magnetic field, modulation amplitude etc). The most important indicators of instrument performance on the indicator’s panel allow the operator to continuously monitor the measurement process.
The fastest way to hear back from us is to fill the contact form below. Our appropriate department will get back to you depending on your inquiry as soon as possible.